GLD Research Pathway
Kaitlyn Williams

Kaitlyn Williams

Aerospace Engineering & Electrical Engineering Minor

University of South Carolina · Class of 2026

This ePortfolio documents my journey through the GLD Research Pathway — where coursework, hands-on research, and professional experience converged into three key insights that define how I approach engineering today.

From Building Toys to Aerospace Engineering

Aerospace Engineering Electrical Engineering Minor AMCODE Lab GE Vernova Raspberry Pi & PLC Systems Women in STEM

My name is Kaitlyn Williams, and I am pursuing Graduation with Leadership Distinction through the Research Pathway at the University of South Carolina. This pathway is especially meaningful to me because it represents the connection between what I have learned in the classroom and how I have applied those concepts in real-world engineering settings. Throughout my undergraduate experience, I have not only gained technical knowledge, but I have also learned how to apply that knowledge through research, system design, and hands-on problem solving.

I am majoring in Aerospace Engineering with a minor in Electrical Engineering. Ever since I was a kid, I have always been interested in building and understanding how things work. I spent a lot of time playing with Legos, Lincoln Logs, and other building toys, which sparked my curiosity for design and problem solving at an early age. That curiosity grew into a passion for aviation after visiting the Dayton Air Force Museum throughout my childhood. Those experiences encouraged me to look deeper into how aircraft function — not just as machines, but as complex systems made up of many interconnected parts.

During my time at USC, my perspective on engineering has expanded significantly. Through my coursework, senior design experience, and research in the AMCODE Lab, I developed three key insights that shape how I approach engineering problems today:

Project Management & Organization

Strong project management and organization are critical for leading successful engineering teams and completing complex projects efficiently.

Fundamental Engineering Principles

Foundational engineering equations are not just theoretical concepts, but essential tools for ensuring safety, reliability, and informed decision-making.

Integrating Hardware, Software & Systems

Understanding how to integrate hardware, software, and system behavior allows me to confidently design and monitor systems in real-world applications.

These insights came together most clearly in my research, where I developed a proof-of-concept test bench and a live monitoring dashboard using a Raspberry Pi. This experience allowed me to bridge concepts from multiple disciplines — including electrical systems, control theory, and data visualization — while reinforcing the importance of structured planning and system validation.

Looking ahead, my goal is to continue developing as an engineer through the Edison Engineering Development Program at GE Vernova while also pursuing a Master's degree in Aerospace Engineering. I hope to work on complex engineering systems where I can apply both my technical knowledge and leadership skills to contribute to meaningful, real-world solutions.

Through this ePortfolio, I hope readers see not only the technical skills I have developed, but also how my experiences have shaped the way I think as an engineer and a leader. More importantly, I hope it reinforces the idea that women belong in STEM and are fully capable of succeeding in challenging engineering fields while genuinely enjoying the process.

Photos
Kaitlyn Williams
Research Symposium
Discover USC
Undergraduate Research Symposium Presentation — Spring 2025

Project Management & Leadership

Project management tools are not only essential for completing complex engineering projects, but they also play an important role in developing leadership and collaboration skills.

Key Insight

What once felt like a natural personal habit — staying organized — has become a skill that I can intentionally apply to complex technical projects. These project management skills have shaped how I approach teamwork, leadership, and problem solving, and it is something I will continue to build on throughout my career.

Growing up, I was always the "organized" kid. Each class had its own color-defined notebook, my clothes were organized by color, and I always had a clean room. At the time, I never would have guessed that those habits would eventually connect to an interest in project management. Even throughout my early engineering coursework, project management was rarely discussed. That changed when I began taking AESP 428, my Aerospace Senior Design course.

The first several weeks of the course focused on the foundations of project management. One of the main resources used to introduce these concepts was a project management lecture presentation (Artifact 1). This presentation outlined the purpose and structure of several important tools, including Work Flow Diagrams (WFD), Work Breakdown Diagrams (WBD), and Gantt Charts — showing how these tools help organize large engineering projects into manageable tasks, clearly define responsibilities, and create a structured timeline for each phase.

Aerospace Senior Design — Project Manager

AESP 428 · University of South Carolina

For my team, I was selected as the project manager, and we decided to design and build an Ultralight Aircraft. In this role, I oversaw the delegation of tasks, ensured the team stayed on track with the strict course timeline, and communicated any conflicts or changes that affected the project. One of the most valuable tools I used was a Gantt Chart (Artifact 2), which identified every required task, assigned responsibility to specific team members, and established start and completion dates across the entire project timeline.

Throughout the semester, the Gantt Chart functioned as a living document — allowing our team to track progress and quickly identify any discrepancies between our initial plan and the current status of the project. Having a clear timeline made it easier to communicate progress with our professor and ensure that design milestones were completed on time.

Configuration Management Intern

GE Vernova · Industry Experience

Beyond the classroom, I also saw how these same tools are used in industry. During my internship with GE Vernova, I was tasked with helping lead the configuration management team through a data migration mapping process from an older product management software to a new system. Because of the number of teams involved and the complexity of the process, we determined that a Gantt Chart would be the best way to manage the project timeline and responsibilities.

Thanks to my experience in AESP 428, I felt confident building a Gantt Chart that outlined the necessary tasks and timelines for the migration process. Although my rotation ended before the project was fully completed, the team continued using the chart to guide the remaining phases — reinforcing the importance of project management in real engineering environments.

Independent Research Project

AMCODE Lab · Dr. De Backer

I also applied these project management tools to my independent research project. I created a Gantt Chart to outline the major stages of the project — including literature review, system development, testing, and documentation (Artifact 3). This timeline helped me break down a large research objective into smaller, manageable tasks and ensured that I remained on schedule throughout the semester.

Before taking AESP 428, I assumed engineering success was primarily based on technical knowledge and design ability. I now recognize that effective organization, communication, and project planning are equally important in ensuring a successful outcome.

Supporting Artifacts
Artifact 1
Project Management Lecture Presentation — AESP 428
Artifact 2
Senior Design Gantt Chart — Ultralight Aircraft
Artifact 3
Research Project Gantt Chart

Not Available for Public Distribution

This Gantt Chart was developed for the independent research project conducted in the AMCODE Lab. This document is not authorized for public publication but is referenced here to acknowledge the structured project planning process used throughout the research.

Fundamental Engineering Principles

Fundamental engineering equations are far more than academic exercises — they are practical tools that directly impact design decisions, safety considerations, and overall system performance.

Key Insight

What once felt like a simple equation became a tool for risk assessment and safety validation. Instead of solving for power to earn points on an exam, I was solving for power to prevent equipment damage and ensure a safe working environment.

While pursuing my aerospace engineering degree, I noticed how beneficial adding a minor in electrical engineering would be. During my sophomore year, I began taking ELCT 221 – Circuits. Early in the course, I was introduced to foundational electrical concepts including AC power analysis and power transformation within electrical systems. Two key resources were the AC Power Presentation (Artifact 4) and the Power Transformation and Transformers Presentation (Artifact 5).

The fundamental electrical power equation P = IV — relating electrical power (P) to current (I) and voltage (V) — initially felt like just another formula to memorize. Using this equation along with its variations P = I²R and P = V²/R, I learned to calculate how much power electrical components would dissipate under certain operating conditions. At the time, these calculations were mostly applied to resistors and theoretical circuits. That understanding became critical when I moved into real-world application.

Proof-of-Concept Test Bench

AMCODE Lab · Dr. De Backer · Junior Year

During my junior year, I was given the opportunity to work in the Additive Manufacturing of Composites and Design Manufacturing (AMCODE) Lab. I was tasked with demonstrating the capability of connecting additive manufacturing machines to an online, easily accessible web browser to allow for live data monitoring during long print processes. To accomplish this, I designed a proof-of-concept test bench that simulated a system capable of sending machine data to a web-based interface.

The test bench consisted of three switches, each associated with an indicator light. When a switch was turned on, the corresponding light would illuminate — simulating how machine inputs and outputs could be monitored digitally. As shown in Artifact 6 (electrical schematic) and Artifact 7 (physical system diagram), the system included:

  • A fused disconnect
  • A power supply unit (120 VAC → 24 VDC)
  • A Siemens Programmable Logic Controller (PLC)
  • Three selector switches with associated indicator lights
  • A Human Machine Interface (HMI)
  • An Emergency Stop switch

Power entered the system through a fused disconnect, supplying 120 VAC to the power supply unit, which converted it to 24 VDC — a common industrial control voltage that is safer and more compatible with electronic control components. Each switch was wired to a PLC input channel; each light to a PLC output channel. When a switch was turned on, it sent a 24-volt signal to the PLC, which then activated the corresponding output and illuminated the light. The fundamental operation: switch input → PLC logic → light output.

Power Budget & Safety Validation

Pre-Power System Check · AMCODE Lab

Before powering the system, I needed to ensure that each component could safely handle the electrical load. To do this, I created a Power Budget (Artifact 8). A power budget is a calculation used to determine how much electrical power each component in a system will consume and whether the available power supply can safely support the total demand.

By applying P = IV, I calculated the expected power consumption and current draw of each component. This allowed me to determine whether the power supply, wiring, and protective components were appropriately rated for safe operation. Without performing this calculation, the system could have experienced overheating, component failure, or potential electrical hazards. The responsibility associated with that shift — from solving for a grade to solving for safety — fundamentally changed how I view foundational engineering principles.

Supporting Artifacts
Artifact 4
AC Power Presentation
Artifact 5
Power Transformation & Transformers Presentation
Artifact 6
Test Bench Electrical Schematic
Artifact 7
Physical System Diagram
Test bench physical system with each component labeled
Artifact 7b
System Flow Diagram
Artifact 8
Power Budget

Integrating Hardware, Software & System Behavior

The true value of control systems coursework was not just learning equations or sampling theory — it was developing the confidence to translate physical behavior into digital representation.

Key Insight

I no longer see hardware, software, and analysis as separate components, but as interconnected pieces of a larger system that I can design and understand. Designing the monitoring system required me to think like an engineer across multiple layers of a system — integrating theory with implementation.

When I first began ELCT 331, Control Systems, I thought I was learning how to solve equations. I did not realize that I was learning how to understand the behavior of real-world systems. Control theory is not just mathematical analysis — it is a framework that allows engineers to confidently bridge hardware, software, and system behavior. Concepts such as system response, stability, and signal representation initially felt theoretical.

Control Systems — Root Locus Analysis

ELCT 331 · University of South Carolina

One of the key topics used to analyze system stability is the root locus method. As shown in Artifact 9, root locus analysis allows engineers to determine whether a system will remain stable by analyzing the locations of system poles as system gain changes. By studying how the poles move in the complex plane as gain increases or decreases, engineers can predict whether a system will remain stable or begin to oscillate.

Although this concept initially felt abstract, it helped me understand an important idea: engineers do not simply build systems and hope they work. Instead, they use mathematical tools to predict how systems will behave before they are even implemented.

Digital Control Systems — Discrete-Time Sampling & Z-Transform

ELCT 531 · University of South Carolina

In Digital Control Systems, I expanded on this knowledge by studying how continuous signals must be sampled at discrete intervals in order to be processed by digital hardware. My notes on the Z-Transform (Artifact 10) demonstrate how engineers convert continuous-time system models into discrete-time representations — moving from the continuous-time s-plane to the discrete-time z-plane.

This transformation is critical because most modern control systems are implemented on digital hardware such as microcontrollers, PLCs, or embedded computers. Without understanding how continuous signals translate into discrete digital representations, engineers would not be able to properly implement control systems in real hardware.

Live Monitoring Dashboard — Raspberry Pi

AMCODE Lab Research · Applied Control Systems

These concepts became far more meaningful when I developed a live monitoring dashboard for my test bench (Artifact 11). The dashboard monitored when the test bench lights were turned on and off based on their connection to physical switches. When a light was turned on, the graph displayed a value of 1; when turned off, 0. The graph continuously progressed in time, displaying the exact moment a switch was activated or deactivated.

Although this system appeared continuous on screen, it was actually operating as a discrete-time monitoring system. The Raspberry Pi sampled the PLC output states once per second (1 Hz) — directly reflecting the sampling concepts I learned in Digital Control Systems. Each second, the program read the input and output bytes from the PLC, converted the switch states into binary values, appended a timestamp, and updated the dashboard.

Understanding sampling rate was critical. A significantly larger sampling interval could show delayed transitions or miss rapid on-off events; sampling at a much higher rate would increase computational demand without meaningfully improving performance for this application. Because of my coursework in ELCT 331 and ELCT 531, I was able to confidently select a sampling interval that balanced responsiveness with system stability.

Beyond the technical implementation, this experience strengthened my ability to bridge hardware, software, and engineering analysis. The physical switches and lights were the hardware layer. The PLC communication and Raspberry Pi code (Artifact 12) were the software layer. The decision-making behind sampling intervals and signal representation reflected control systems theory.

Supporting Artifacts
Artifact 9
Root Locus Rules & Example Notes
Artifact 10
Z-Transform Notes
Artifact 11
Live Monitoring Dashboard
Raspberry Pi live monitoring dashboard showing binary switch states over time
Artifact 12
PLC Monitoring Dashboard — HTML Source Code
<!DOCTYPE html>
<html>
<head>
    <title>PLC Monitoring Dashboard</title>
    <script src="https://cdn.jsdelivr.net/npm/chart.js"></script>
    <style>
        body { font-family: Arial, sans-serif; background-color: #f0f0f0;
               max-width: 1200px; margin: 0 auto; padding: 10px; }
        .dashboard-grid { display: grid; grid-template-columns: repeat(2, 1fr);
                          gap: 10px; margin-top: 10px; }
        .chart-container { background-color: white; padding: 10px;
                           border-radius: 5px; box-shadow: 0 2px 5px rgba(0,0,0,0.1);
                           height: 200px; }
        h1 { color: #333; text-align: center; font-size: 24px; }
        .chart-title { text-align: center; color: #555; font-size: 16px; }
    </style>
</head>
<body>
    <h1>PLC Monitoring Dashboard</h1>
    <div class="dashboard-grid">
        <div class="chart-container">
            <h2 class="chart-title">E-Stop Status</h2>
            <canvas id="estopChart"></canvas>
        </div>
        <div class="chart-container">
            <h2 class="chart-title">Light 1 Status</h2>
            <canvas id="light1Chart"></canvas>
        </div>
        <div class="chart-container">
            <h2 class="chart-title">Light 2 Status</h2>
            <canvas id="light2Chart"></canvas>
        </div>
        <div class="chart-container">
            <h2 class="chart-title">Light 3 Status</h2>
            <canvas id="light3Chart"></canvas>
        </div>
    </div>
    <script>
        function createChart(canvasId, label, color) {
            return new Chart(document.getElementById(canvasId), {
                type: 'line',
                data: {
                    labels: [],
                    datasets: [{ label: label, data: [], borderColor: color,
                                 backgroundColor: color, borderWidth: 1,
                                 pointRadius: 2, fill: false }]
                },
                options: {
                    responsive: true, maintainAspectRatio: false, animation: false,
                    scales: {
                        y: { min: 0, max: 1, ticks: { stepSize: 1 } },
                        x: { ticks: { maxRotation: 0, autoSkip: true, maxTicksLimit: 5 } }
                    },
                    plugins: { legend: { display: false } }
                }
            });
        }

        const estopChart  = createChart('estopChart',  'E-Stop',  'rgb(255, 99, 132)');
        const light1Chart = createChart('light1Chart', 'Light 1', 'rgb(54, 162, 235)');
        const light2Chart = createChart('light2Chart', 'Light 2', 'rgb(255, 206, 86)');
        const light3Chart = createChart('light3Chart', 'Light 3', 'rgb(75, 192, 192)');

        function updateCharts(data) {
            [estopChart, light1Chart, light2Chart, light3Chart].forEach((chart, i) => {
                const key = ['estop','light1','light2','light3'][i];
                chart.data.labels = data.timestamps;
                chart.data.datasets[0].data = data[key];
                chart.update();
            });
        }

        // Fetch PLC state data from Raspberry Pi server every second
        function fetchData() {
            fetch('/data')
                .then(response => response.json())
                .then(data => updateCharts(data))
                .catch(error => console.error('Error fetching data:', error));
        }

        setInterval(fetchData, 1000);  // 1 Hz sampling rate
    </script>
</body>
</html>

A Framework for Engineering Labs

Proposing a structured, low-cost framework integrating project management, system validation, and real-time monitoring to close the gap between academic engineering labs and industry expectations.

Leadership Opportunity

By integrating structured organization, technical validation, and real-time system monitoring, this initiative addresses a gap between academic practices and industry expectations — and creates an opportunity to improve how students approach complex engineering problems.

Throughout my academic and professional experiences, I have learned that successful engineering projects require more than just technical knowledge. They require structured organization, validation of system behavior, and the ability to integrate hardware, software, and data into a cohesive system. One issue I have observed is the lack of standardized project management practices and real-time monitoring systems in academic engineering labs. While this observation comes from my own experience, it is also supported by broader research in engineering education. Studies have shown that student engineering teams often struggle with coordination, unclear roles, and inconsistent use of formal project management tools, which can negatively impact both learning outcomes and project success (Borrego, Karlin, McNair, & Beddoes, 2013). Additionally, industry expectations increasingly emphasize systems engineering, data integration, and continuous monitoring — skills that are critical in practice but not always fully developed in academic lab environments (INCOSE, 2021).

This gap creates several challenges, including disorganized workflows, missed deadlines, inefficient communication, and potential safety risks due to insufficient system validation. Additionally, without real-time monitoring, it becomes difficult for students and faculty to track system behavior during long-duration processes, identify issues early, or make data-driven decisions. Research from the National Academy of Engineering highlights that modern engineers must be able to work across disciplines, manage complex systems, and use data effectively, further emphasizing the importance of addressing this issue at the academic level (National Academy of Engineering, 2004). To address this problem at a smaller, more immediate scale, I would focus on implementing a standardized framework for project management, system validation, and real-time monitoring within a lab environment.

Organized Project Planning

As shared in Key Insight 1, effective leadership requires structured organization and intentional planning. The first component of my solution is the use of project management tools such as Work Breakdown Structures and Gantt Charts to create a standardized approach to organizing lab-based projects. As I learned in my Aerospace Senior Design course, these tools help break complex projects into manageable tasks, clearly define responsibilities, and establish realistic timelines. Research shows that structured planning improves team accountability and increases the likelihood of project success (Project Management Institute, 2021). By requiring each project to begin with a structured plan, teams would be better equipped to stay on schedule, communicate effectively, and remain accountable throughout the project lifecycle.

Validated System Design

Building on Key Insight 2, which emphasizes applying fundamental engineering knowledge to ensure safe and effective system design, the second component is a required system validation process focused on safety and reliability. Based on my experience in ELCT 221 and my research project, I learned that fundamental engineering relationships — such as electrical power calculations — are critical for ensuring systems operate safely. Each project would include a power budget and component validation step to confirm that all components are properly rated and that the system can operate without risk of overheating or failure. This aligns with industry practices in systems engineering, where verification and validation are essential to reducing risk and improving system reliability (INCOSE, 2021).

Integrated Real-Time Monitoring

As shared in Key Insight 3, understanding and interpreting system behavior is 
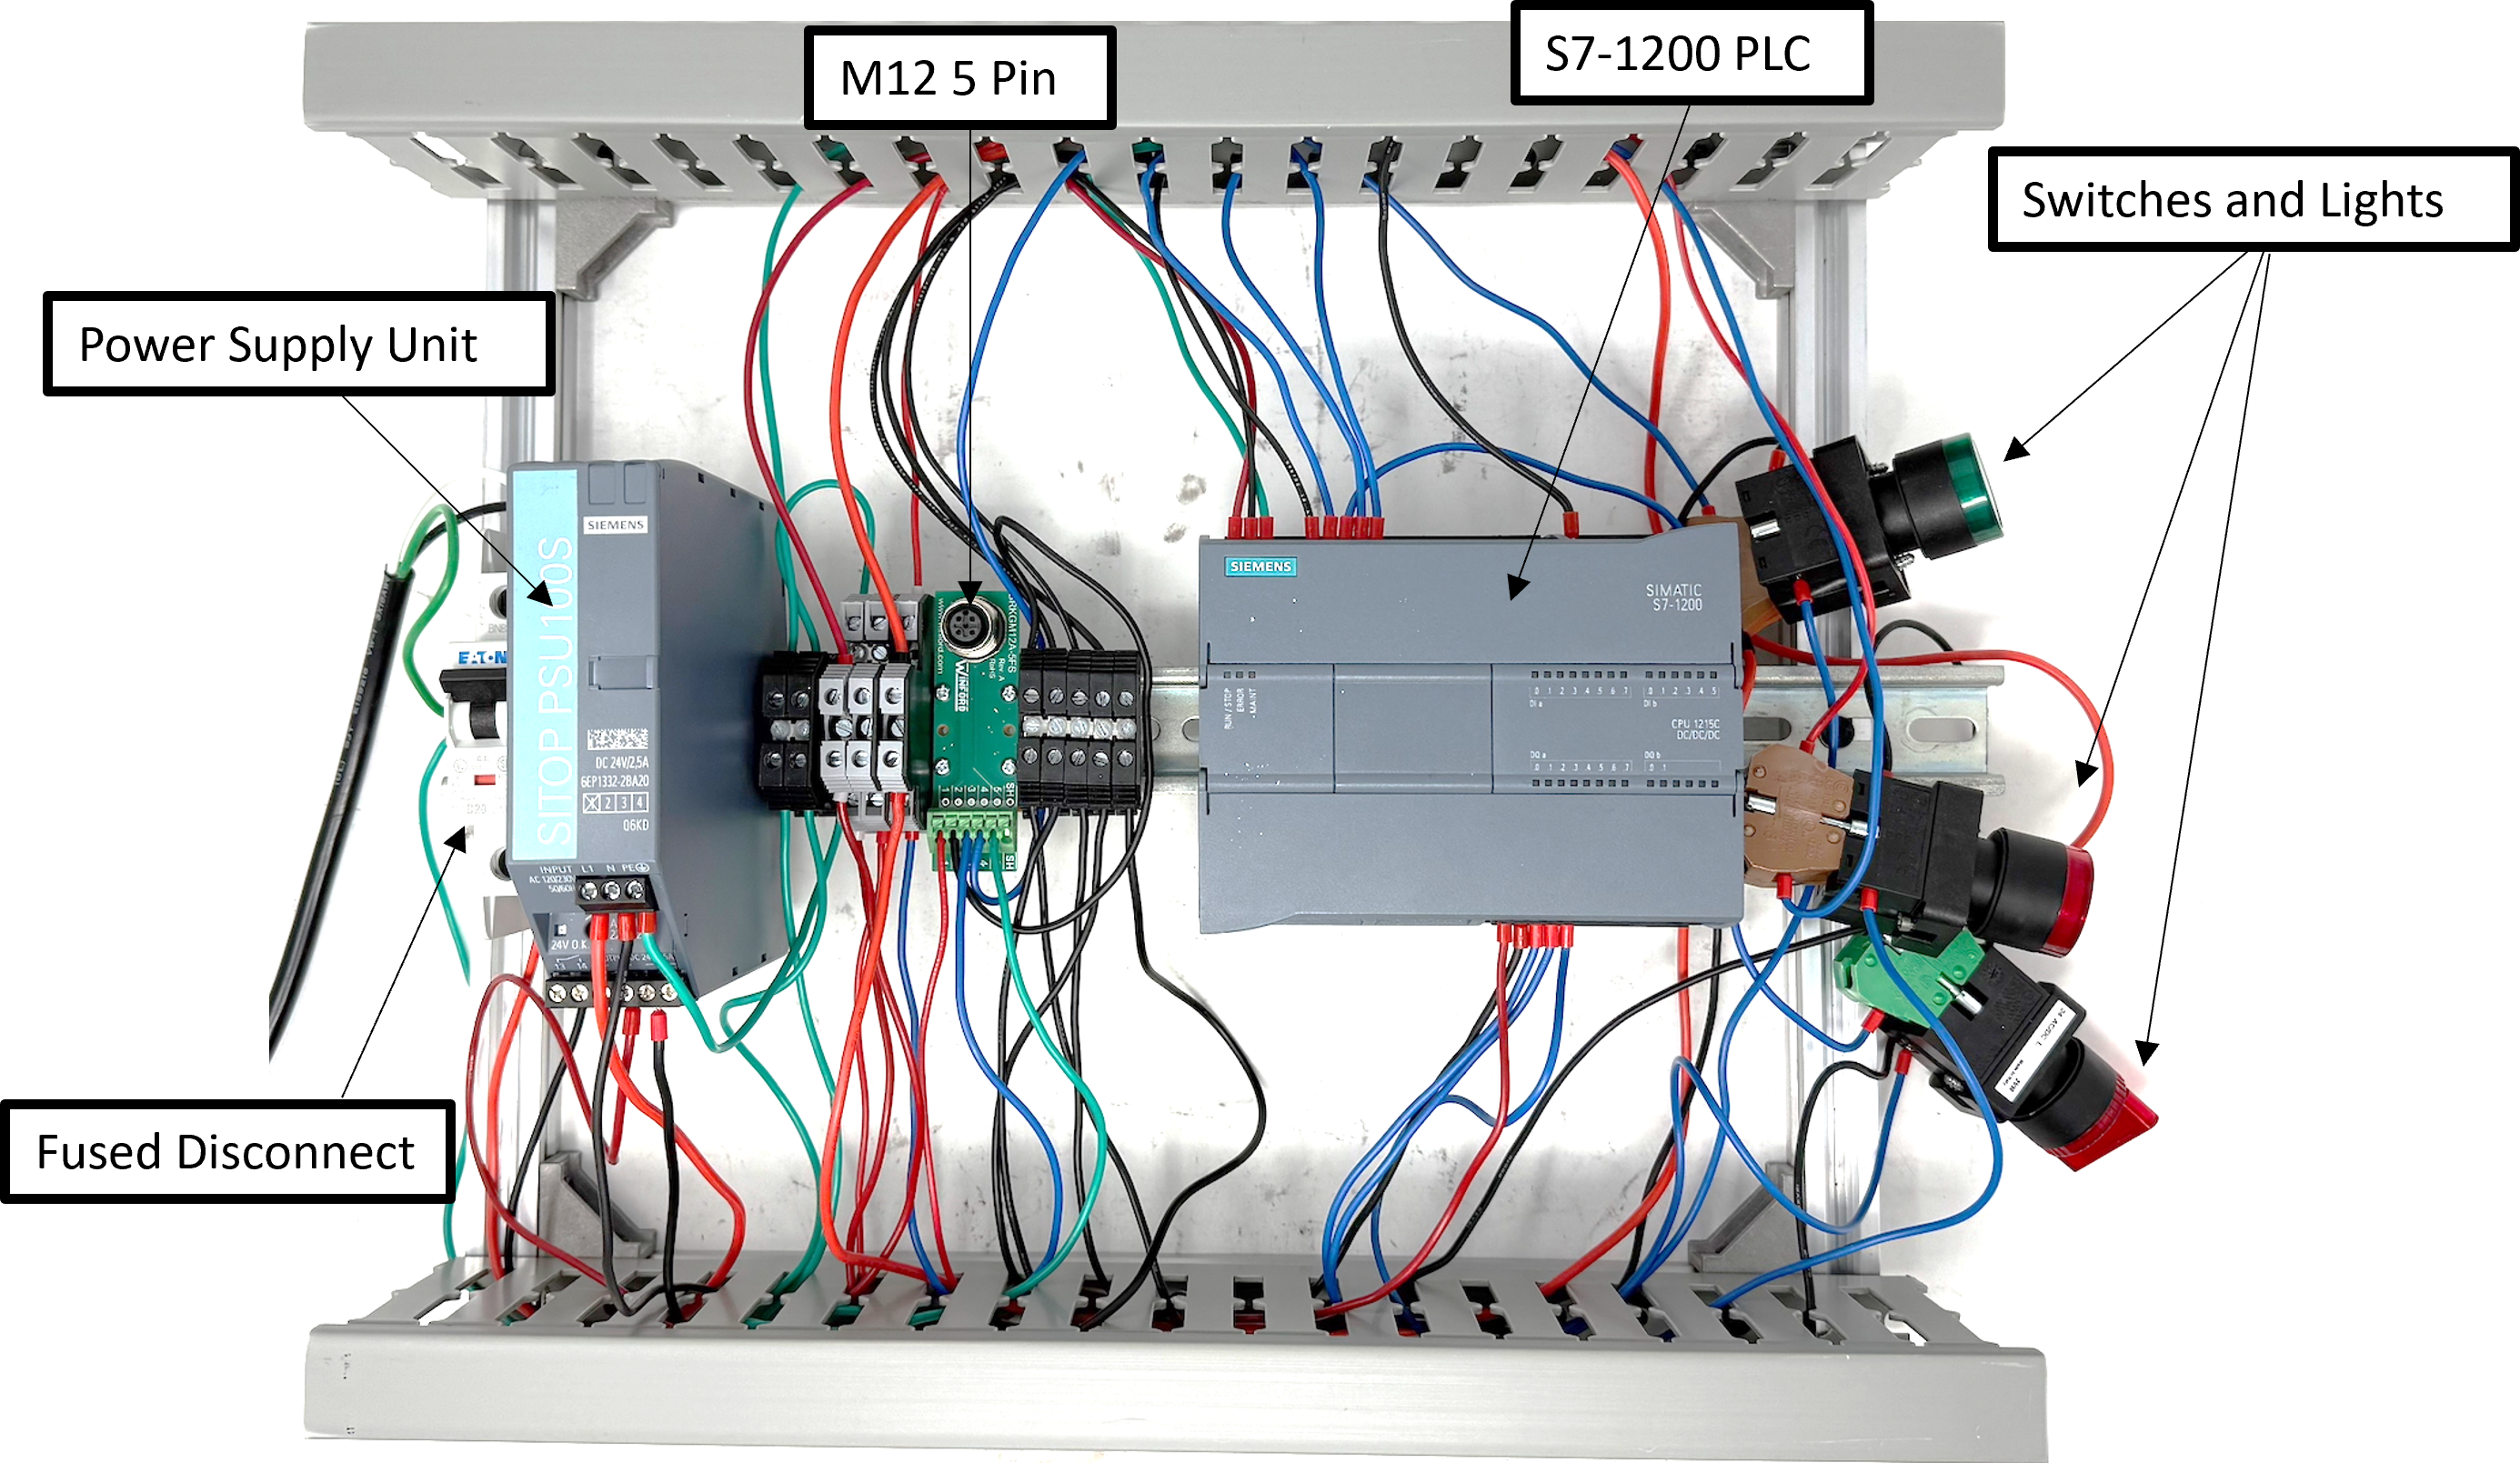
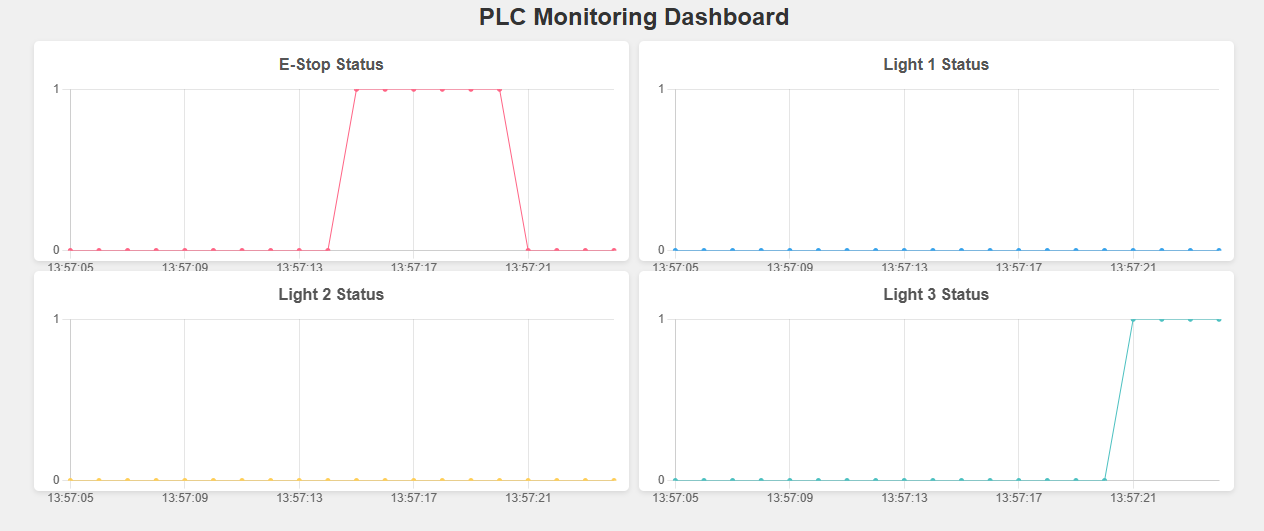
essential for effective engineering decision-making. The third component is the implementation of a standardized real-time monitoring system using accessible tools such as a PLC and a Raspberry Pi-based dashboard. Through my experience in Control Systems and Digital Control Systems, I learned how to interpret system behavior and translate physical signals into digital data through sampling. Research on digital monitoring and "digital twin" technologies shows that real-time data improves system performance, reduces downtime, and enhances decision-making (Tao, Qi, Liu, & Kusiak, 2018). This would be especially valuable for long-duration processes such as additive manufacturing, where continuous observation is not always practical.

Implementation Plan

To implement this framework, I would follow a structured, step-by-step plan. Step 1 would be to develop standardized templates for project planning, including Gantt Charts, task breakdown structures, and validation documentation. Step 2 would involve training students and lab users through a short workshop or instructional module to ensure consistent understanding of the framework. Step 3 would be a pilot implementation on a small-scale project — such as a test bench like the one I developed during my research — including assigning team roles, establishing a clear timeline, completing a power budget, and building a monitoring dashboard. Step 4 would involve collecting data throughout the project, including timeline adherence, number of system issues, and usage of the monitoring system. Step 5 would be refinement, where feedback from both students and faculty is used to improve the framework before expanding it to additional lab projects.

Evaluation

Evaluation of this framework would focus on both project performance and system effectiveness. Quantitative metrics would include improvements in project completion timelines, reductions in system errors or safety concerns, and increased use of monitoring tools. Qualitative data would be collected through surveys and feedback from students and faculty to assess usability and overall impact. Comparing project outcomes before and after implementation would provide a clear measure of success and identify areas for further improvement.

Through this process, I aim to apply my key insights in a meaningful and practical way. By integrating structured organization (Key Insight 1), technical validation (Key Insight 2), and real-time system monitoring (Key Insight 3), this initiative addresses a gap between academic practices and industry expectations. More importantly, it creates an opportunity to improve how students approach complex engineering problems, helping them develop the skills needed to succeed in both academic and professional environments.

References

Borrego, M., Karlin, J., McNair, L. D., & Beddoes, K. (2013). Team effectiveness theory from industrial and organizational psychology applied to engineering student project teams. Journal of Engineering Education, 102(4), 472–512.

INCOSE. (2021). Systems Engineering Handbook: A Guide for System Life Cycle Processes and Activities (5th ed.). Wiley.

National Academy of Engineering. (2004). The Engineer of 2020: Visions of Engineering in the New Century. National Academies Press.

Project Management Institute. (2021). A Guide to the Project Management Body of Knowledge (PMBOK Guide) (7th ed.).

Tao, F., Qi, Q., Liu, A., & Kusiak, A. (2018). Data-driven smart manufacturing. Journal of Manufacturing Systems, 48, 157–169.